Analyzing Objects
You can visualize and analyze the distribution of scalar data contained in a multi-ROI in the Object Analysis dialog, as well as create classes by selecting instances in the data that match some criteria. You can work in the Histogram or Table view, or a combination of both, to complete an analysis (see Working in the Histogram View and Working in the Table View).
You can start a connected components analysis from any multi-ROI that contains the required scalar data (see Computing Measurements for Multi-ROIs for information about computing scalar data for multi-ROIs).
You can do the following in the Histogram view:
- Click the column headers to change the plotted statistical property.
- Color the histogram with a LUT.
- Create classes by making selections on the histogram (see Creating Classes with Statistical Properties).
- Plot two parameters against each other and then select clusters to populate classes (see Creating Classes by Plotting Multiple Properties).
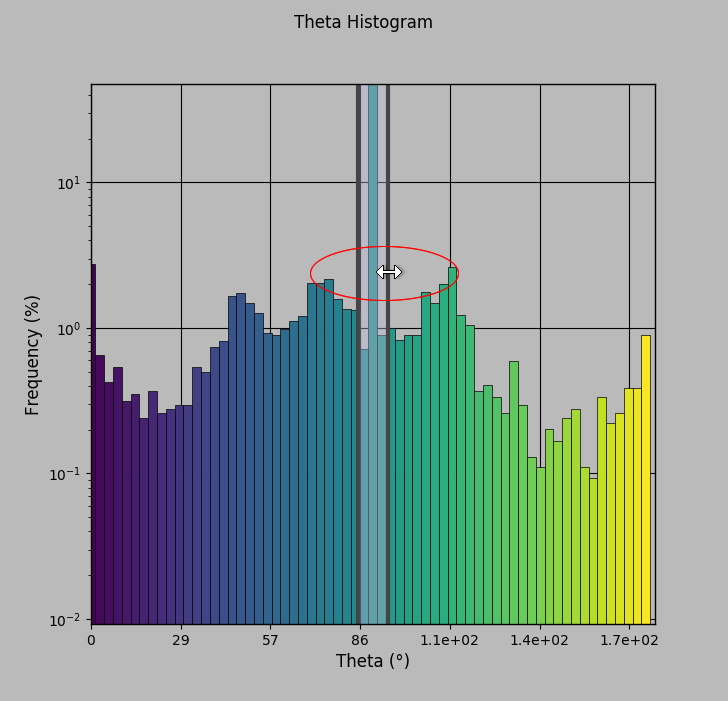
Histogram view

| Icon | Description | |
|---|---|---|
| Bins | - | Indicates the number of bins used to compute the histogram. If required, you can change the number of bins in the drop-down menu. |
| Range selector |

|
Automatically adds a new class to the Subgroup analysis box. You can adjust the range of values included in the class as follows:
|
| Threshold values | - | Indicates the minimum and maximum threshold values that define the range selected on the histogram. |
| Log Y | - | If checked, the Y axis of the histogram will be plotted in log scale. |
| Reset |
|
Resets the original view of the figure. |
| Pan |
|
Pans or zooms the figure as described below.
Pan… Click with the left mouse button and then drag to pan the figure. Zoom on the Y axis… Click with the right mouse button and then drag up and down to Zoom in and Zoom out on the Y axis. Zoom on the X axis… Click with the right mouse button and then drag left and right to Zoom in and Zoom out on the X axis. |
| Zoom |
|
Zooms to a selected rectangle, which can be defined by dragging your cursor over the area that you want to zoom. |
| Save |
|
Saves the figure as a bitmap image, vector graphic, or in the PDF file format. The figure can also be saved as raw data or PGF code for LaTeX.
Standard image files (*.jpeg, *.jpg, *.png, *.tif, *.tiff extensions)… Saves the figure as a bitmap image in the screen resolution. Postscript files (*.eps, *.ps extensions)… Saves the figure as an encapsulated postscript or postscript file. These types of files have a selectable resolution and provide high-quality graphics for publications. PGF code for LaTeX (.pgf extension)… Saves the figure in the Portable Graphics file format. Raw RGBA bitmap (*.raw, *.rgba extensions)… Saves the figure as a raw bitmap image file, in which the file contains only a list of pixel colors and nothing else. Scalable vector graphics (*.svg, *.svgz extensions)… Saves the figure in an XML-based vector image format. The SVG specification is an open standard developed by the World Wide Web Consortium (W3C). SVG images and their behaviors are defined in XML text files. Portable document format (*.pdf extension)… Saves the figure in the Adobe PDF file format. |
You can create classes directly in the Histogram view using any of the statistical properties that are available for the multi-ROI (see Computing Measurements for Multi-ROIs for information about choosing the statistical properties with which you want to work).
- Click the toggle button on the top left of the Object Analysis dialog to view your data in the Histogram view, if required.
- Click a column header to select the statistical property you want to plot in the histogram.
The selected property is plotted in the histogram. If required, you change the number of bins and plot the Y axis in log scale.
- Click the Range Selector
 tool.
tool. - Drag your cursor over the histogram to add a selection to a new class, as shown below.
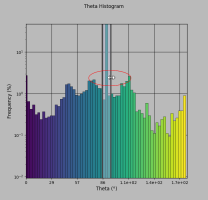
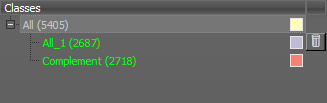
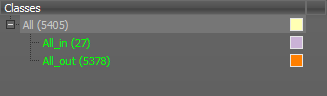
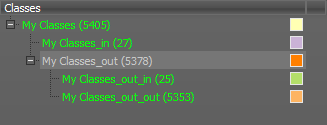
The new class and its complement appear in the Classes box.
Note You can double-click the name of a class and then enter a new name. You can also delete a class, in which case all objects in the class will moved up in the Classes tree.
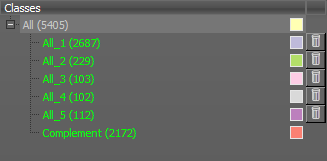
- Add additional classes, as required.
Each time that you make a new selection on the histogram, a new class will be created automatically.
- If required, you can create sub-classes as follows:
- Select the required class in the Classes box. The histogram is updated automatically.
- Click the Range Selector tool and then drag your cursor over the histogram to add the selection to a new sub-class.
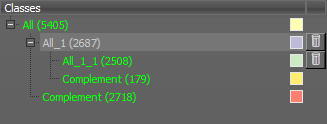
- Continue to add classes and sub-classes until your analysis is complete.
Note You can view the classes in the workspace by selecting Subgroup in the Color by box. You can also color the multi-ROI by Branches or Leaves (see Color By Options).
- Export your analysis results (see Exporting Classes).
You can also plot multiple properties in the Histogram view and then create classes from clustered objects (see for information about choosing the statistical properties with which you want to work).
Histogram view with multiple properties plotted

| Icon | Description | |
|---|---|---|
| Bins | - | Indicates the number of bins used to compute the histogram. If required, you can change the number of bins in the drop-down menu. |
| Class selector | - | Lets you select a class or add a new class to the Subgroup analysis box. |
| Show histogram | - | If checked, the histogram will be shown. |
| Show ROI | - | If checked, the classes will be shown on the histogram. |
| Square brush |
|
You use the Square Brush tool to paint selections on the histogram. You can change the diameter of the brush with the mouse scroll wheel. |
| Round brush |
|
You use the Square Brush tool to paint selections on the histogram. You can change the diameter of the brush with the mouse scroll wheel. |
| Y log | - | If checked, the Y axis of the histogram will be plotted in log scale. |
- Click the toggle button on the top left of the Object Analysis dialog to view your data in the Histogram view, if required.
- Select the statistical property you want to plot on the X-axis.
- Ctrl-click the statistical property you want to plot on the Y-axis.
The selected properties are plotted in the histogram. If required, you change the number of bins and plot the Y axis in log scale.
- Click the Square Brush
 or Round Brush
  tool.
tool.
An initial class is created automatically whenever you first use a Brush tool.
- Do the following to add or remove selections from the initial class:
- Hold down Left Ctrl (or your configured Add with key) and then drag in the histogram to add selections to the class.
- Hold down Left Shift (or your configured Remove with key) and then drag in the histogram to remove selections from the class.
Note You can change the diameter of the brush with the mouse scroll wheel.
- If required, you can create additional classes as follows:
- Click the Add
 button below the histogram.
 - Use the Square or Round Brush tool to add or remove selections from the new class, as described previously.
Note If you draw over an existing class, the intersecting selection will be moved to the new class.
- Click the Add
- If required, you can create sub-classes as follows:
- Select the required class in the Classes box.
- Click the Add button below the histogram.
- Use the Square or Round Brush tool to add or remove selections from the new sub-class, as described previously.
- Continue to add classes and sub-classes until your analysis is complete.
NOTE You can view the classes in the workspace by selecting Subgroup and in the Color by box. You can color the multi-ROI by Branches or Leaves (see Color By Options).
- Export your analysis results (see Exporting Classes).
In Table view you can:
- Select objects directly in the table. You can also work in Pick mode and select objects directly in image displays.
- Sort columns in ascending or descending order.
- Create classes for objects that share specific characteristics.
Table view

You can create classes in the Table view by selecting objects directly in the table or by selecting objects in image displays (see for information about choosing the statistical properties with which you want to work).
- Click the toggle button on the top left of the Object Analysis dialog to view your data in the Table view, if required.
- Click a column header to sort data within a statistical property, if required.
- Do the following, as required:
- Select the objects that you want to add to the first class directly in the table.
- Click the Pick mode
 button on the top left of the dialog and then select the objects you want to add to the first class directly in an image display. See Object Analysis Tools for more information about working in Pick mode.
- Click the Add button at the bottom of the table to add the selected objects to the first class.
The new classes (_in) and (_out) appear in the Classes box.
Note You can double-click the name of a class and then enter a new name. You can also remove a filter, in which case all objects in the class will moved up in the Classes tree.
- If required, you can create sub-classes as follows:
- Select the required class in the Classes box. The objects listed in the table and displayed onscreen are updated according to your selection.
- Select the objects that you want to add to the sub-class directly in the table or in an image display.
- Click the Add button at the bottom of the table to add the selected objects to the sub-class
You can remove objects from a sub-class by first selecting the objects you need to remove and then selecting the originating class. Click the Remove
 button at the bottom of the table to remove the objects from their sub-class.
- Continue to add sub-classes until your analysis is complete.
Note You can view the classes in the workspace by selecting Subgroup and in the Color by box. You can color the multi-ROI by Branches or Leaves (see Color By Options).
- Export your analysis results (see Exporting Classes).
You can export classes and sub-classes to either a new multi-ROI or to a CSV file.
| Description | |
|---|---|
| New Multi-ROI | Exports all the objects in the selected class or sub-class to a new multi-ROI. |
| CSV | Exports the data of all objects in the selected class or sub-class to a CSV file (see Miscellaneous Preferences for information about selecting a CSV file delimiter). |
- Right-click the class you want to export in the Classes box.
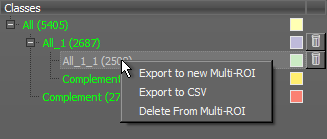
- Choose the required export option in the pop-up menu.
A number of configured actions and keyboard shortcuts are available for working in the Object Analysis dialog. The default settings for these actions are listed in the following table.
| Action | Key | Mouse |
|---|---|---|
| Add to Object Analysis | Left Ctrl | Left mouse |
| Remove from Object Analysis | Left Shift | Left mouse |
| Delete selected objects | Delete | |
| Select object | Left mouse | |
| Select object in order to add or remove | Left Ctrl | Left mouse |
